Post-Processor
Similarly to its Pre-Processor counterpart, the Post-Processor area features a series of modules where results from different type of analysis can be viewed in table or graphical format, and then copied into any other Windows application (e.g. tabled results can be copied into a spreadsheet like Microsoft Excel, whilst results plots can be copied into a word-processing application, like Microsoft Word).
- Analysis Logs
- Modal/Mass Quantities
- Target Displacement
- Step Output
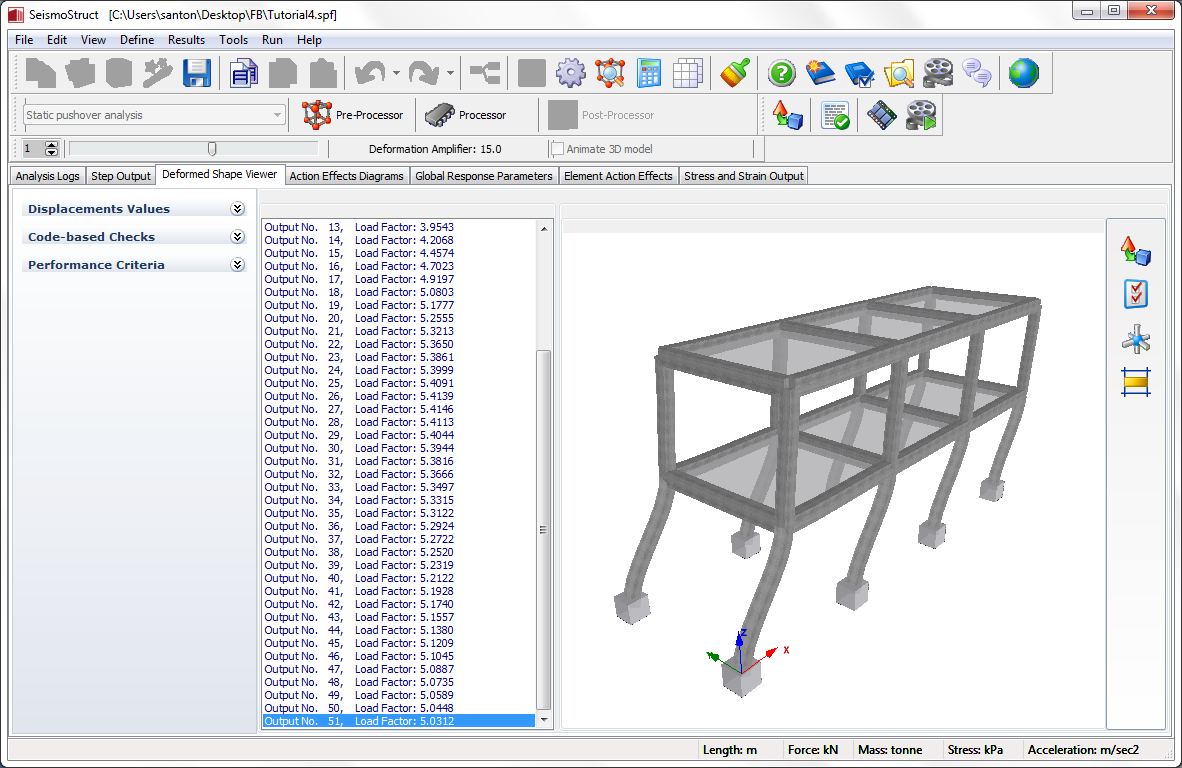
- Deformed Shape Viewer
- Convergence Problems
- Action Effects Diagrams
- Code-based Checks
- Global Response Parameters
- Element Action Effects
- Performance Criteria Checks
- Stress and Strain Output
- IDA Envelope Curve
Users may apply a multiplying factor or coefficient to the results by changing some parameters in the Post-Processor Settings dialog box. This facility can be accessed through the program menu (Tools > Post-Processor Settings...) or through the corresponding toolbar button ![]() . Further details are given at the following link:
. Further details are given at the following link:
The graphs can be tweaked and customised using the Plot Options facility, available from the main menu (Tools > 3D Plot Options…), toolbar button ![]() or right-click popup menu. The user can then change the characteristics of the lines (colour, thickness, style, etc.), the background (colour, gradient), the axes (colour, font size and style of labels etc.) and the titles of the plot. Zooming in and out can be done by dragging the mouse on the graph area (a top-left to bottom-right selection zooms in, whereas a bottom-right to top-left selection zooms out).
or right-click popup menu. The user can then change the characteristics of the lines (colour, thickness, style, etc.), the background (colour, gradient), the axes (colour, font size and style of labels etc.) and the titles of the plot. Zooming in and out can be done by dragging the mouse on the graph area (a top-left to bottom-right selection zooms in, whereas a bottom-right to top-left selection zooms out).
Furthermore, the way in which model components (e.g. nodes, sections, elements, etc.) are sorted in their respective pre-processor modules, reflects the way these entries appear on all dialogue boxes in the post-processor. For instance, if the user chooses to employ alphabetical sorting of the nodes, then these will appear in alphabetical order in all drop-down menus where nodes are listed, which may, in a given case, ease and speed up their individuation and selection. In addition, when using drop-down lists with many entries, users can start typing an item's identifier so as to reach it quicker.
Note: Before copying results plots into other Windows applications, users might wish to remove the plot's background gradient, which looks good on screen but comes out quite badly on printed documents. This can be done easily in the Panel tab of the Plot Options dialog box.