Deformed shape viewer
With the deformed shape viewer, users have the possibility of visualising the deformed shape of the model at every step of the analysis (click on the desired output identifier to update the deformed shape view), thus easily identifying deformation, and eventually collapse, mechanisms. The possibility of visualising the zones of the structure where different Code-based Capacity Checks and Performance Criteria have been met is also available, by ticking the appropriate options on the 'Code-based Checks' and the 'Performance Criteria' area on the left of the screen. It is noted that the visualisation of the elements that have exceeded their capacity can be done by colour and/or the damage visual effects that have been set up in the Pre-Processor.
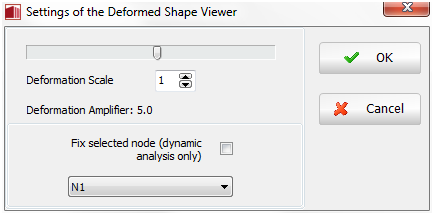
The deformed shape plot can be tweaked and customised using the 3D Plot options and then copied to any Windows application by means of the Copy 3D Plot facility. In addition, and whenever the real-time deformed shape of the structure is difficult to interpret (because displacements are either too large or too small), users can make use of the Deformed Shape Multiplier, available from the right-click popup menu or through the main menu (Tools > Deformed Shape Settings…) or through the corresponding toolbar button ![]() , to better adapt the plot.
, to better adapt the plot.
The option to automatically update the 3D model after changing the multipliers is available. Users may deactivate this option and update it manually by clicking on the update 3D plot button on the right.
Finally, and in the case of dynamic analysis, it is also useful to check the Fix selected node option, so that only the relative displacements of the structure, which are those of interest to engineers, are plotted. The 'selected node' should obviously be a node at the base of the structure in order for this option to work.
Note: In order for deformed shape plots to be available, nodal response parameters must have been output for all structural nodes (see Output module), otherwise the Post-Processor will not have sufficient information to compute this type of plots.