Display Settings and 3D Plot Options
The settings of the 3D Plot of the structural model being created can be adjusted to best meet the user's likings and requirements. From version 6 a new toolbar is available on the right of the screen in each Pre-Processor module. Each feature is described hereafter:
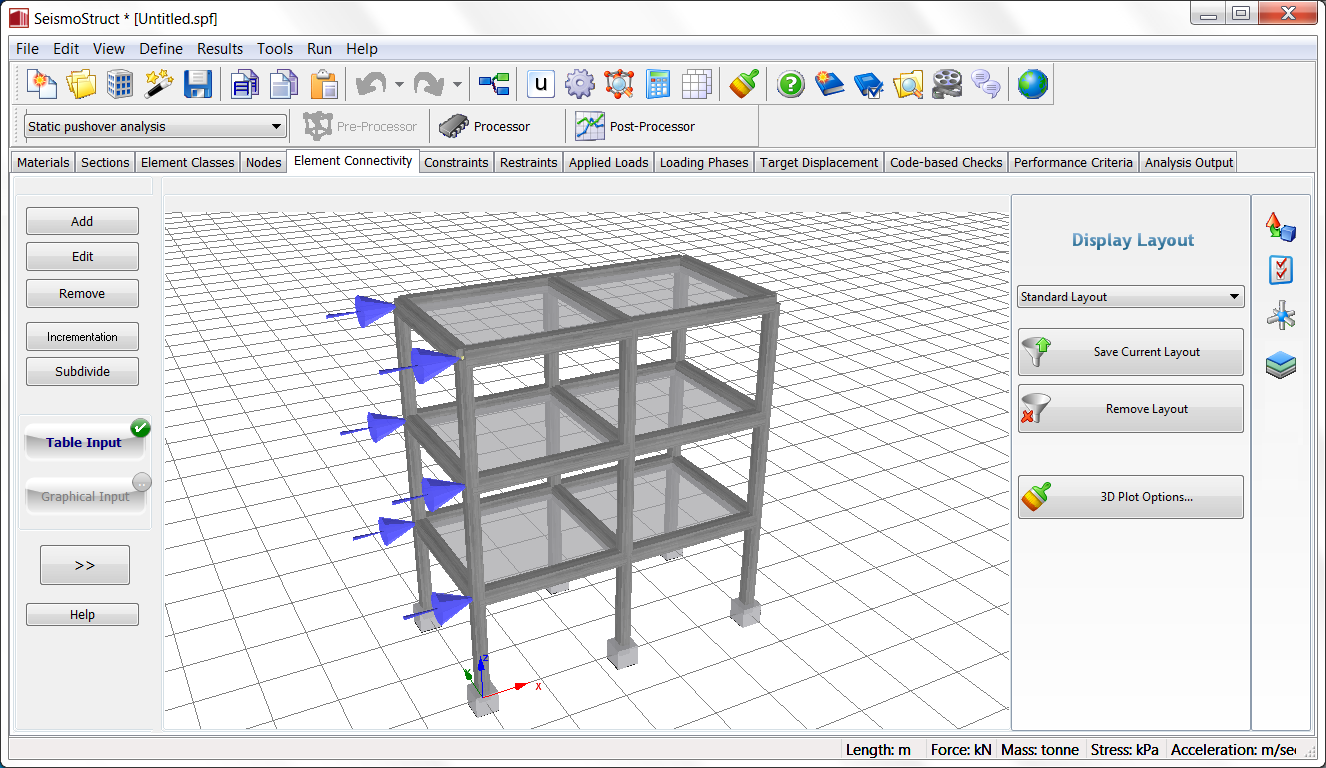
Display Layout
Within this pop-up menu, accessible through the toolbar button ![]() , users can (i) select a pre-defined layout, such as Standard Layout (default), Transparent elements and Line elements (the latter is particularly useful to visualise internal forces results), (ii) save their personal Display Layouts or (iii) change the 3D Plot Options.
, users can (i) select a pre-defined layout, such as Standard Layout (default), Transparent elements and Line elements (the latter is particularly useful to visualise internal forces results), (ii) save their personal Display Layouts or (iii) change the 3D Plot Options.
Save Current Layout - 
Users may wish to save the changes made in the 3D Plot settings. To do so they have to (i) click on the toolbar button ![]() , (ii) assign a name to the new layout configuration and finally (iii) click the OK button to confirm the operation. The new layout will appear in the drop-down menu located in the toolbar. Further, the user may always return to the initial default layout by selecting the Standard Layout option from the drop-down list.
, (ii) assign a name to the new layout configuration and finally (iii) click the OK button to confirm the operation. The new layout will appear in the drop-down menu located in the toolbar. Further, the user may always return to the initial default layout by selecting the Standard Layout option from the drop-down list.
3D Plot Options... - 
The full range of plotting adjustment parameters, on the other hand, can be found in the 3D Plot Options dialog box, accessible from the main menu (Tools > 3D Plot Options…) or through the corresponding toolbar button.
Within the 3D Plot Options menu, there are a number of submenus from which users can not only select which model components (nodes, frame and mass/damping elements, links, etc.) to show in the plot but also change a myriad of settings such as the colour/transparency of elements, the plot axes and background panels, the colour/transparency of load symbols, the colour of text descriptors, and so on.
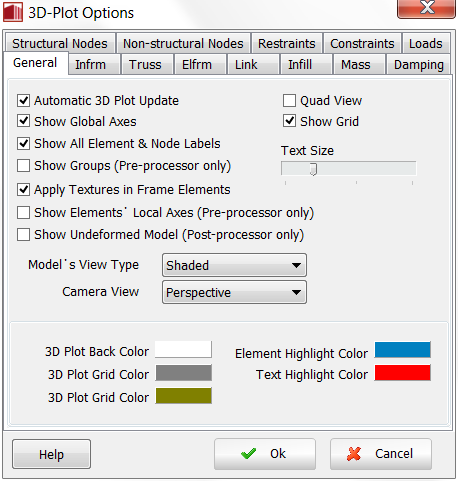
By default, the 3D Plot is automatically updated, implying that for every input change (e.g. addition of a node or an element), the model plot is refreshed in real-time. This behaviour may be undesirable in cases where the structural model is very large (several hundreds of nodes and elements) and/or the user is using a laptop running on batteries with a slowed-down CPU (so as to increase the duration of battery). In such situations the program takes some seconds to update the view, hence it might prove to be more convenient for users to disable this feature (uncheck the Automatic 3D Plot Update option in the 3D Plot Options General submenu) and thus opt for manual updating instead, carried out with the Redraw 3D Plot command, found in the Tools and popup menus.
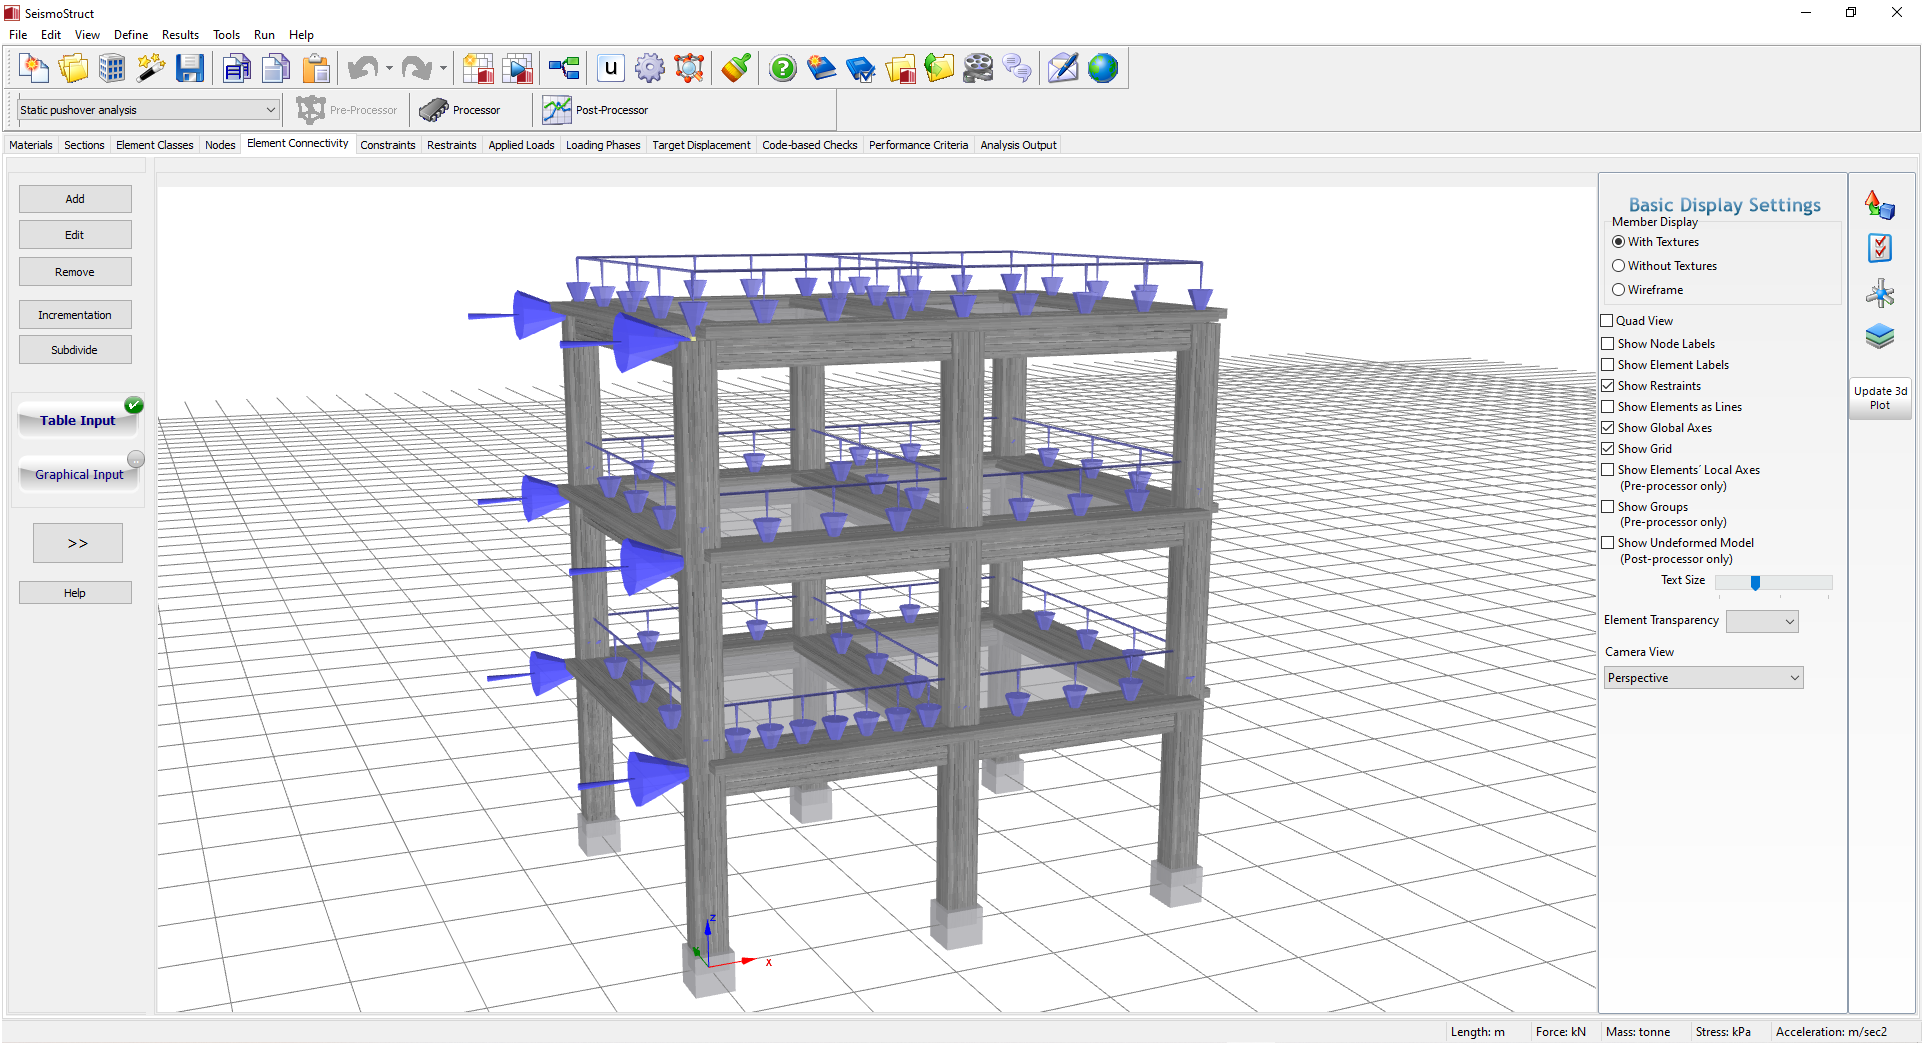
Basic Display Settings
Within this pop-up menu, accessible through the toolbar button ![]() , users can tweak the most commonly used plotting features (view type, rendering options, names show, local axes representation, element transparency, and so on) using the available check-boxes and drop-down menus.
, users can tweak the most commonly used plotting features (view type, rendering options, names show, local axes representation, element transparency, and so on) using the available check-boxes and drop-down menus.
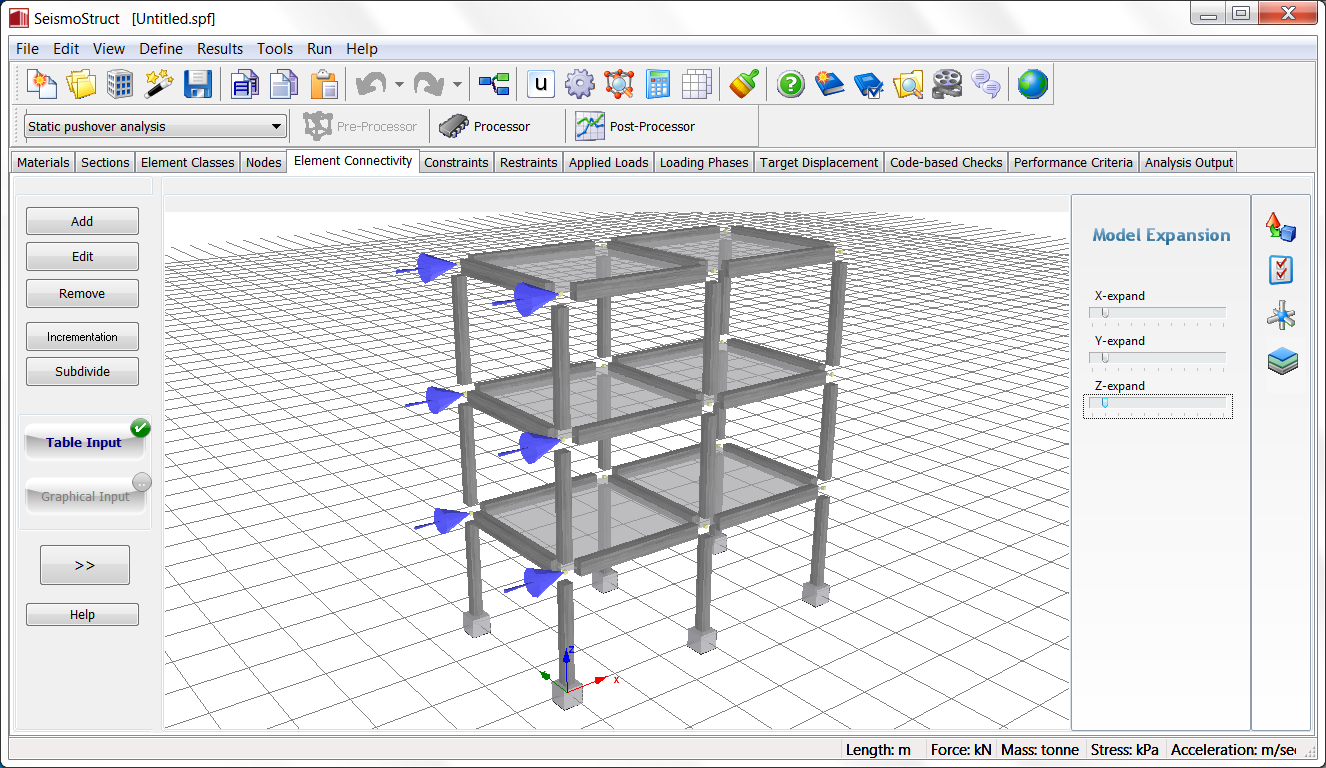
Model Expansion
Using this feature, the 3D model may be expanded in each global direction (i.e. X, Y and Z) by moving the corresponding cursor.
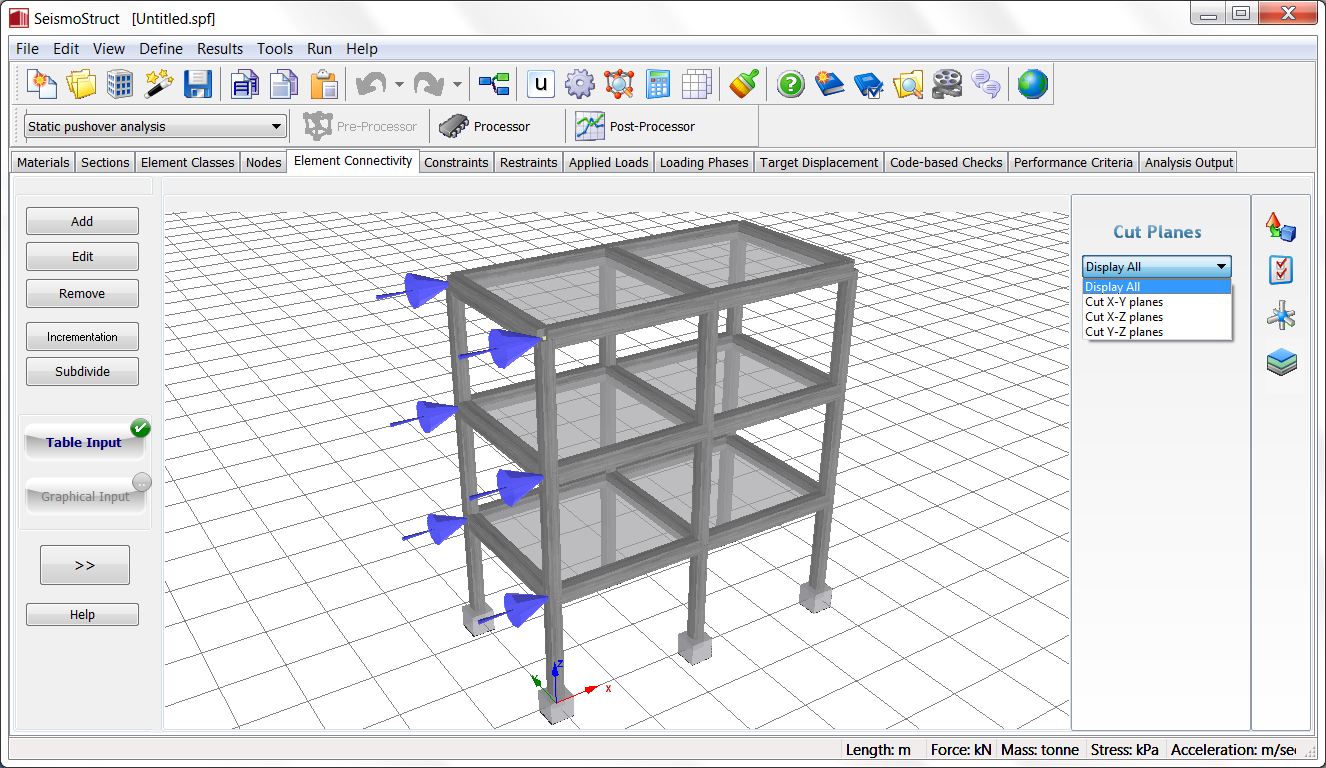
Cut Planes
In addition to the previous features, also the Cut Planes option can be activated. By default the Display All option is selected from the drop-down menu.
Additional operations
Users can also quickly zoom, rotate, and move the 3D/2D plot of the structural model, by using either the mouse (highly recommended) or keyboard shortcuts, as described in here. Further, it is also possible to point&click nodes and elements (in the respective module), so as to quickly select their corresponding list entry. If, instead, the user chooses to double-click a given node/element, then the corresponding editing dialog box opens.
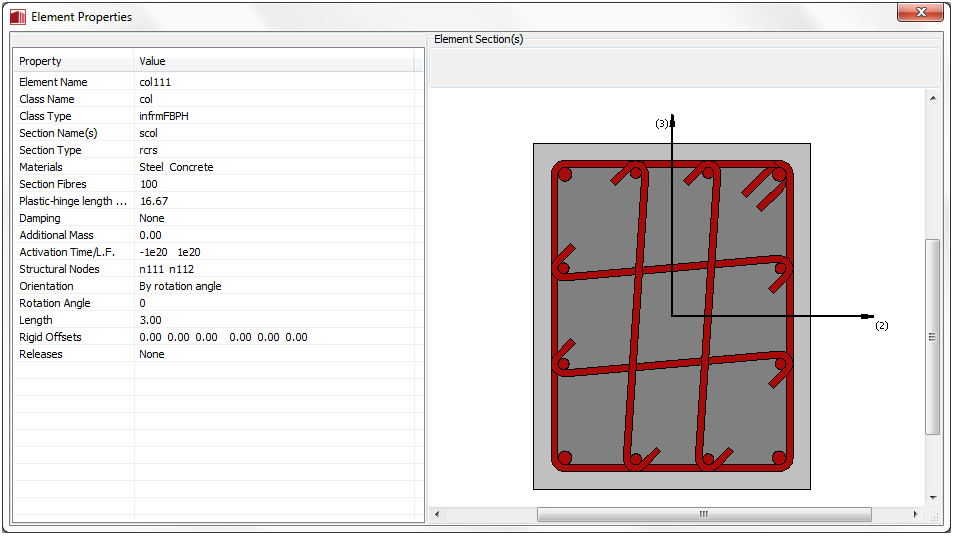
Finally, by right-clicking on a given element, users can visualise the "summary" of the element properties in a specific dialog box (-> Element Properties from the drop-down menu). It is also possible to click on a particular element properties line in order to be taken to the corresponding module.
Notes
- It is noted that when users define non-structural nodes with very large coordinates, and then activate visualisation of such nodes, the model will inevitably be zoomed-out to a very small viewing size. To avoid such a scenario, users should (i) bring the non-structural nodes closer to the structure, (ii) disable visualisation of the latter or (iii) zoom-in manually every time the 3D plot is refreshed.
- Activating visualisation of local axes may result in a quite congested 3D model representation, especially when link elements are present, rendering difficult the interpretation/check of local axes' orientation. In such cases, users may simply disable visualisation of some elements (e.g. frame elements) in order to more readily check some others (e.g. links).