Modified Richard-Abbott curve - Richard_Abbott
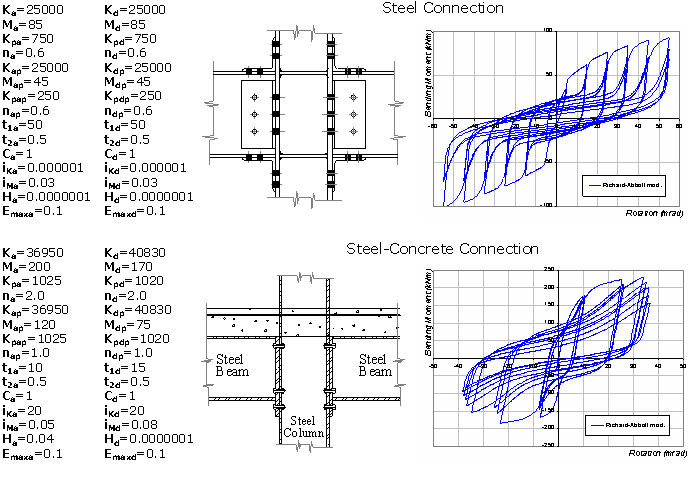
This is a modified Richard-Abbott hysteresis loop, programmed and implemented by Nogueiro et al. [2005a] based on the proposals of De Martino et al. [1984] and Della Corte et al. [2000], who in turn had built upon the original work of Richard and Abbott [1975]. The model is very flexible, being capable of modelling all sorts of steel and composite connections (e.g. welded-flange bolted-web connection, extended end-plate connection, flush end-plate connection, angle connection, etc.), for as long as the model parameters are calibrated accordingly, as demonstrated by Della Corte et al. [2000], Simoes et al. [2001] and Nogueiro et al. [2005a], amongst others. Thirty parameters need to be defined in order to fully characterise this response curve.
Note: If a symmetric behaviour is sought, the second set of 15 parameters is identical to the first half.
Input parameters for the ascending (positive) branches
Initial stiffness for the upper bound curve (Ka)
Its values may typically range from 15000 to 50000 kNm/rad, the default being 12000 kNm/rad.
Strength for the upper bound curve (Ma)
Normally equal to 1.1-1.3 of the yield moment capacity of the connection. Its values may typically range from 75 to 250 kNm, the default being 45 kNm.
Post-elastic stiffness for the upper bound curve (Kpa)
Its values may typically range from 0.02Ka to 0.05Ka, the default being 200 kNm/rad.
Shape parameter for the upper bound curve (Na)
Its value is normally (though not always) assumed as equal to 4, which is therefore the default.
Initial stiffness for the lower bound curve (Kap)
Its value is normally assumed as equal to Ka, hence the default is 12000 kNm/rad.
Strength for the lower bound curve (Map)
Its values may typically range from 0.45Ma to 0.65Ma, the default being 5 kNm.
Post-elastic stiffness for the lower bound curve (Kpap)
Its value is normally (though not always) assumed as equal to Kpa, hence the default is 200 kNm/rad.
Shape parameter for the lower bound curve (Nap)
Its value is normally (though not always) assumed as equal to 4, which is therefore the default.
Empirical parameters related to the pinching
- t1a: its values may typically range from 5 to 20, the default being 30.
- t2a: its values may typically range from 0.15 to 0.5, the default being 0.03.
- Ca: its value is normally assumed as equal to 1, which is therefore the default.
Empirical coefficient related to the stiffness damage rate (iKa)
Its values may typically range from 3 to 25, the default being 0.
Empirical coefficient related to the strength damage rate (iMa)
Its values may typically range from 0.01 to 0.1, the default being 0.03.
Empirical coefficient defining the level of isotropic hardening (Ha)
Its values may typically range from 0.01 to 0.04, the default being 0.02.
Maximum value of deformation (i.e. rotation) reached in the loading history (Emaxa)
This value will obviously depend on the imposed loading, and may typically range from 0 to 0.2 rad, the default being 0.5 rad.
Input parameters for the descending (negative) branches
Initial stiffness for the upper bound curve (Kd)
Its values may typically range from 15000 to 50000 kNm/rad, the default being 12000 kNm/rad.
Strength for the upper bound curve (Md)
Normally equal to 1.1-1.3 of the yield moment capacity of the connection. Its values may typically range from 75 to 250 kNm, the default being 45 kNm.
Post-elastic stiffness for the upper bound curve (Kpd)
Its values may typically range from 0.02Kd to 0.05Kd, the default being 200 kNm/rad.
Shape parameter for the upper bound curve (Nd)
Its value is normally (though not always) assumed as equal to 4, which is therefore the default.
Initial stiffness for the lower bound curve (Kdp)
Its value is normally assumed as equal to Kd, hence the default is 12000 kNm/rad.
Strength for the lower bound curve (Mdp)
Its values may typically range from 0.45Md to 0.65Md, the default being 5 kNm.
Post-elastic stiffness for the lower bound curve (Kpdp)
Its value is normally (though not always) assumed as equal to Kpd, hence the default is 200 kNm/rad.
Shape parameter for the lower bound curve (Ndp)
Its value is normally (though not always) assumed as equal to 4, which is therefore the default.
Empirical parameters related to the pinching
- t1d: its values may typically range from 5 to 20, the default being 30.
- t2d: its values may typically range from 0.15 to 0.5, the default being 0.03.
- Cd: its value is normally assumed as equal to 1, which is therefore the default.
Empirical coefficient related to the stiffness damage rate (iKd)
Its values may typically range from 3 to 25, the default being 0.
Empirical coefficient related to the strength damage rate (iMd)
Its values may typically range from 0.01 to 0.1, the default being 0.03.
Empirical coefficient defining the level of isotropic hardening (Hd)
Its values may typically range from 0.01 to 0.04, the default being 0.02.
Maximum value of deformation (i.e. rotation) reached in the loading history (Emaxd)
This value will obviously depend on the imposed loading, and may typically range from 0 to 0.2 rad, the default being 0.5 rad.
Below, example applications extracted from the work of Nogueiro et al. [2005a] are given, in order to illustrate the modelling capacites of this response curve (it is noted that in the Steel Connection below some parameters assume non-typical values):
