Time Series and Response Spectra
Once the artificial accelerograms have been generated, it is possible to visualise the results in terms of both time series and response spectra.
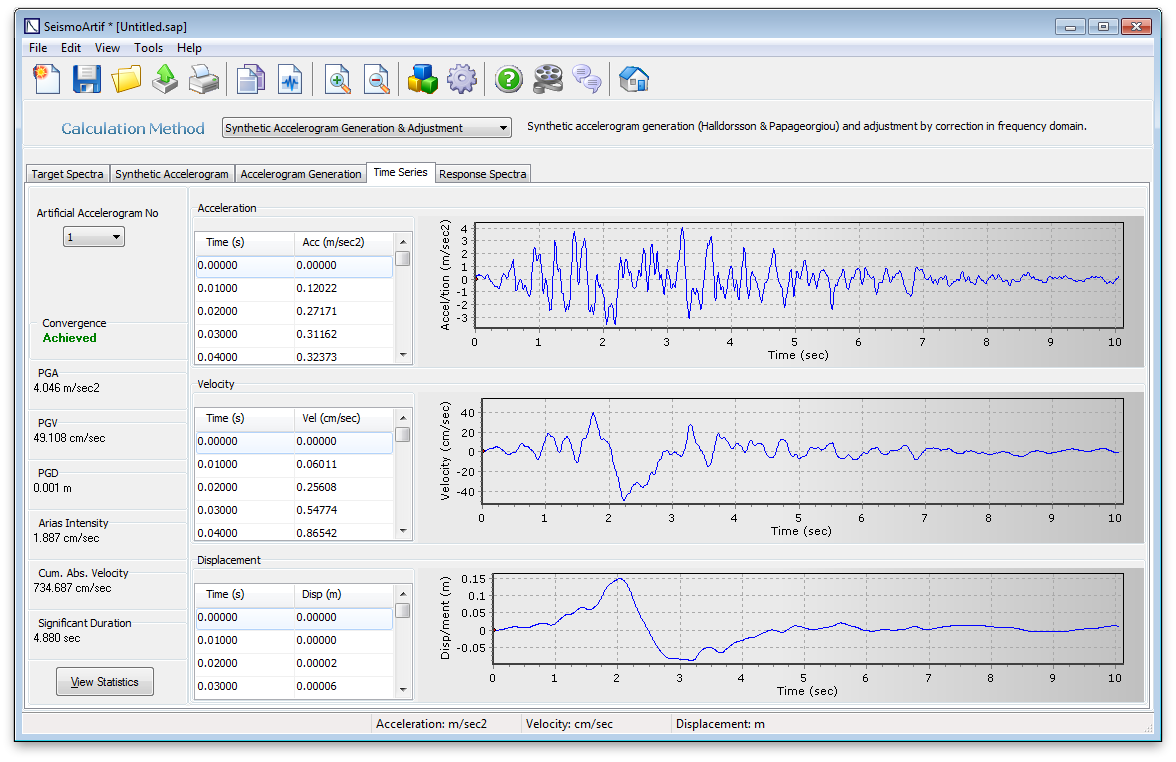
The time series (acceleration, velocity, displacement) are given in the 'Time Series' module, where the envelope name (if the Artificial Accelerogram Generation method or the Artificial Accelerogram Generation & Adjustment method has been selected), convergence status, PGA, PGV, PGD, Arias Intensity, CAV, Significant Duration (A5-95) are also shown, so as to provide the user with an immediate overview of the characteristics of each generated artificial accelerogram.
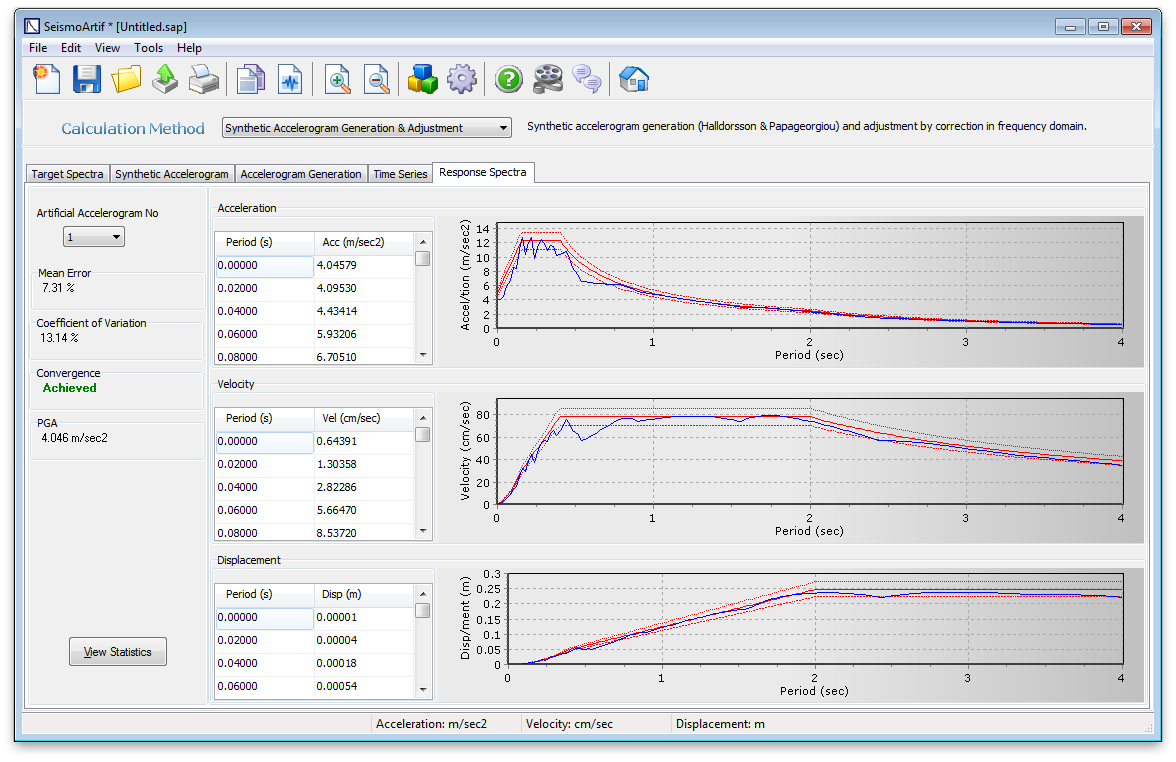
The corresponding response spectra are shown in the 'Response Spectra' module, where a comparison with the target spectrum (plotted in red) is also provided, with the dotted lines indicating the tolerance defined in the Settings. The mean error, coefficient of variation (with respect to the target spectrum), convergence status and PGA are also shown. Please refer to here for further details on how response spectra are computed.
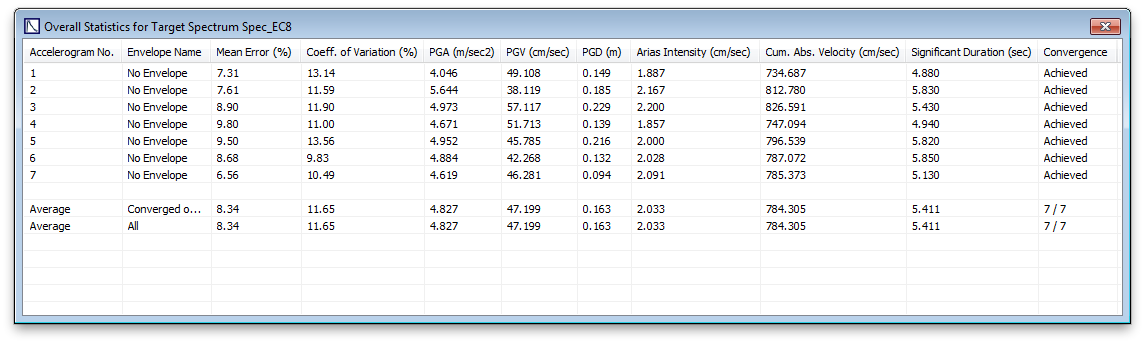
In both 'Time Series' and 'Response Spectra' modules users can also click on the View Statistics button in order to see the overall statistics for every artificial signal.