Ground Motion Parameters
Intensity Parameters
In this module, a number of commonly computed ground motion parameters are provided, as specified in the Program Settings panel. By default, they are shown only for the corrected accelerogram. If, however, in the Baseline Correction and Filtering module the user has opted to visualise the original "uncorrected" input motion, here the ground motion parameters will be shown also for the uncorrected record, in order to allow the user compare them with the filtered ones (see figure below); it is noted that the data points of the Arias Intensity and Energy Flux plots are given only for the corrected accelerogram (if a user wishes to obtain such data also for the uncorrected accelerogram, he/she will need to disable baseline correction or filtering and copy the data into an external application, for subsequent comparison).
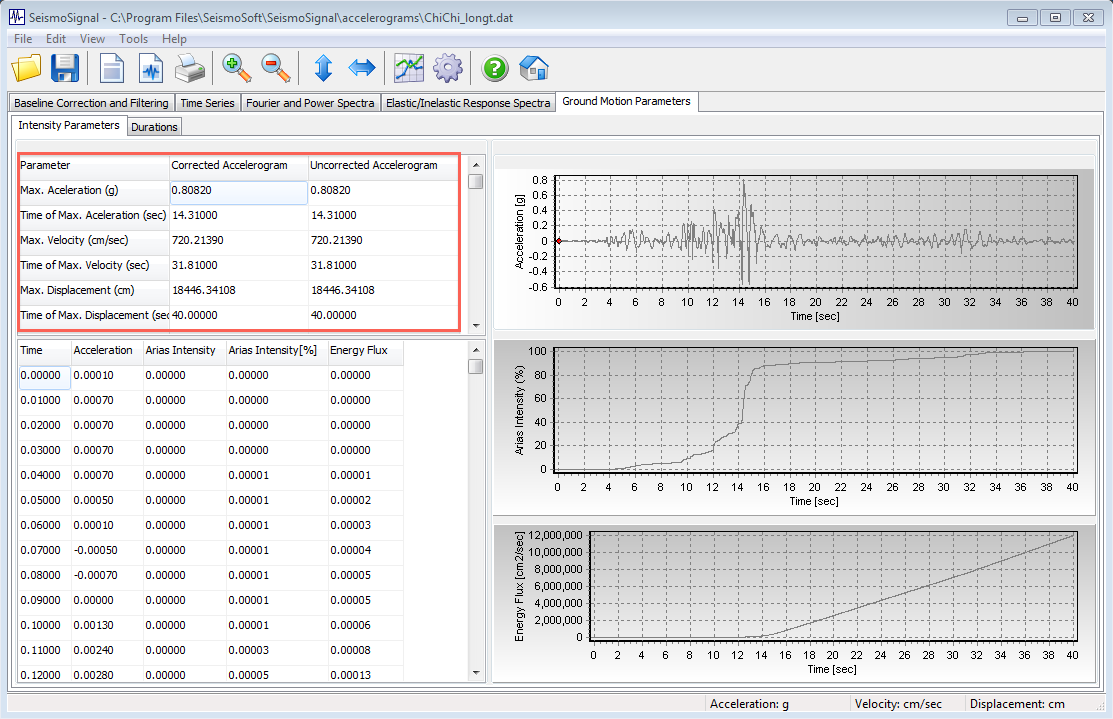
Users are referred to the work by Kramer [1996] for a detailed description and discussion on the employment of such ground motion quantities.
Peak ground values of acceleration (PGA), velocity (PGV) and displacement (PGD)
![]() ;
; ![]() ;
; ![]()
Peak velocity and acceleration ratio (vmax/amax)
Root-mean-square (RMS) of acceleration, velocity and displacement
 ;
;  ;
; 
Arias Intensity (Ia)

Characteristic Intensity (Ic)
![]()
Specific Energy Density (SED)
![]()
Cumulative Absolute Velocity (CAV)
![]()
Acceleration (ASI) and Velocity (VSI) Spectrum Intensity [Von Thun et al., 1988]
 ;
; 
Housner Intensity (HI)

Sustained maximum acceleration (SMA) and velocity (SMV)
Introduced by Nuttli [1979], this parameter gives the sustained maximum acceleration/velocity during three cycles, and is defined as the third highest absolute value of acceleration/velocity in the time-history (note: in order for an absolute value to be considered as a "maximum", it must be larger than values 20 steps before and 20 steps after).
Effective Design Acceleration (EDA)
This parameter corresponds to the peak acceleration value found after lowpass filtering the input time history with a cut-off frequency of 9 Hz [Benjamin and Associates, 1988].
A95 parameter [Sarma and Yang, 1987]
The acceleration level below which 95% of the total Arias intensity is contained. In other words, if the entire accelerogram yields a value of Ia equal to 100, the A95 parameter is the threshold of acceleration such that integrating all the values of the accelerogram below it, one gets an Ia=95.
Predominant Period
The predominant period (Tp) is the period at which the maximum spectral acceleration occurs in an acceleration response spectrum calculated at 5% damping.
Mean Period (Tm)
According to Rathje et al. [1998] the mean period (Tm) is the best simplified frequency content characterisation parameter, being estimated with the following equation, where Ci are the Fourier amplitudes, and fi represent the discrete Fourier transform frequencies between 0.25 and 20 Hz.
Maximum Incremental Velocity [MIV]
The Maximum Incremental Velocity (MIV) is defined as the maximum area under the acceleration curve between two zero crossings of the accelerogram. Users are referred to the works by Anderson and Bertero [1987] and Guaman [2010] for further information for description and discussion on the topic.
Damage Index
The Damage Index is calculated as the summation of the amplitudes of the cycles in the accelerogram raised to the c exponent, determining the relative importance of different amplitude cycles, and multiplied by the C linear scale factor as proposed by Malhotra [2002]. The cycles and the corresponding cycle amplitudes for the accelerogram are identified through a rainflow counting algorithm as described by ASTM [1985], the values of the exponent c and the multiplier C can be defined in the Ground Motion Parameters Menu. The procedure is summarized by Hancock and Bommer [2005].
Number of Effective Cycles
The Number of Effective cycles is calculated as the summation of the ratios of the amplitudes of the cycles in the accelerogram divided by the maximum cycle amplitude and raised to the c exponent, determining the relative importance of different amplitude cycles, as proposed by Malhotra [2002]. The cycles and the corresponding cycle amplitudes for the accelerogram are identified through a rainflow counting algorithm as described by ASTM [1985] and the value of the c exponent can be defined in the Ground Motion Parameters Menu. The procedure is summarized by Hancock and Bommer [2005].
Impulsivity Index (IP) [Panella et al., 2017]
The Impulsivity index is an indicator of the impulsive character of the ground motion and is calculated as the developed length of velocity of the velocity time-series divided by the Peak Ground Velocity.
Average Spectral Acceleration (Sa,avg/AvgSa) [Bianchini et al. 2009]
The Average Spectral Acceleration is computed as the geometric mean of the spectral pseudo-acceleration ordinates for a 5% damping according to Bianchini et al. [2009]. The maximum and minimum periods and the period step of the specrum used for the computation of the Average Spectral acceleration can be defined in the Ground Motion Parameters Menu.
Standardized Cumulative Absolute Velocity (CAVSTD) [Campbell and Bozorgnia 2011]
The Standardized Cumulative Absolute Velocity is defined from equation:
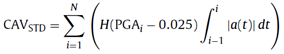
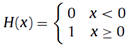
where N is the number of discrete 1-s time intervals, PGAi is the value of the peak ground acceleration (g) in time interval i (inclusive of the first and last values), and H(x) is the Heaviside Step Function, defined by the expression:
Husid plot [Husid, 1969]
The Husid plot represents the build-up of the Arias Intensity.
Energy Flux plot
The Energy flux plot represents the build-up of Specific Energy Density.
Ground Motion Durations
In this module, four different type of record durations are also computed. Users are referred to the work by Bommer and Martinez-Pereira [1999] for a thorough and pertinent discussion on the topic.
Bracketed duration
The total time elapsed between the first and the last excursions of a specified level of acceleration (default is 5% of PGA).
Uniform duration
The total time during which the acceleration is larger than a given threshold value (default is 5% of PGA).
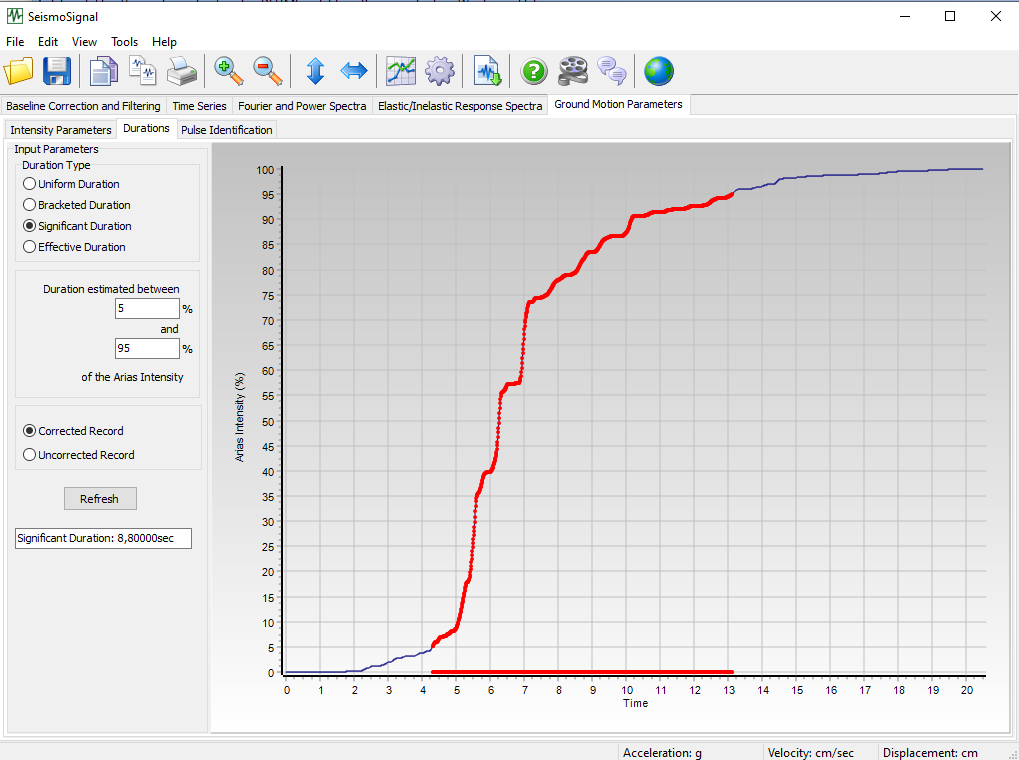
Significant duration
The interval of time over which a proportion (percentage) of the total Arias Intensity is accumulated (default is the interval between the 5% and 95% thresholds).
Effective duration
It is based on the significant duration concept but both the start and end of the strong shaking phase are identified by absolute criteria.
Note: In the bracketed and uniform duration plots, the square of the acceleration values are shown, so as to ease visualisation and interpretation of the obtained results. However, and evidently, in the internal calculations of these parameters, the absolute, not the square, of the acceleration values are employed.
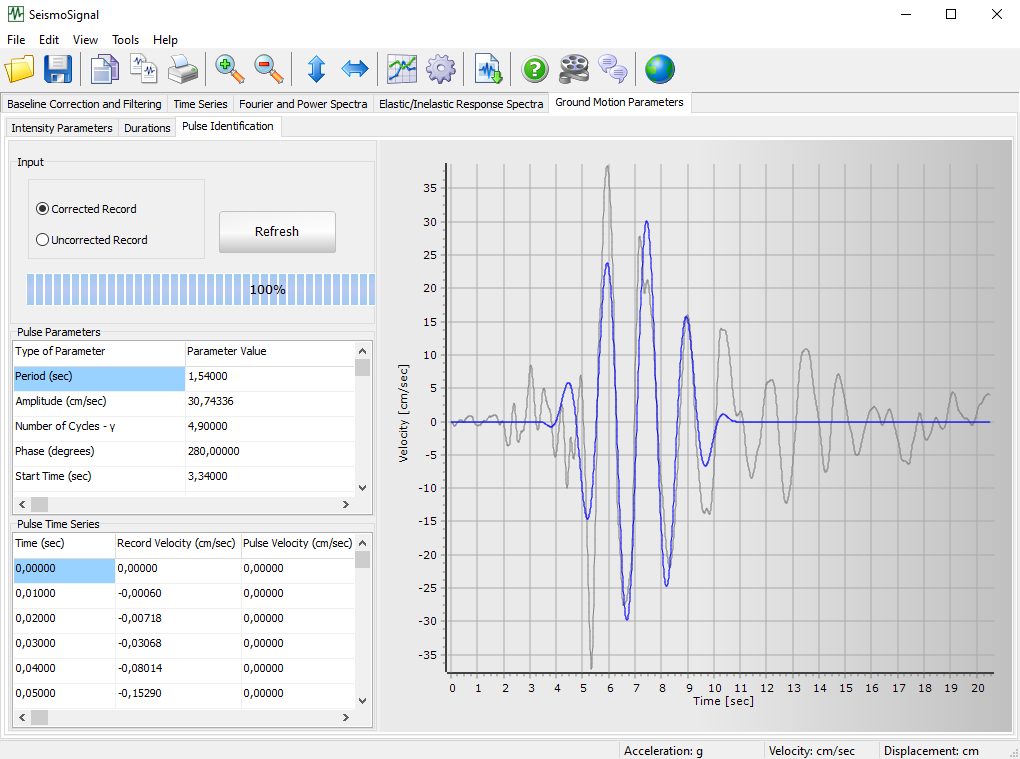
Pulse Identification
This is a pulse identification module for the characterization of seismic motions as pulse-like or non-pulse-like, according to Kardoutsou et al. [2017]. Apart from the definition of a new pulse indicator (PI), which is defined as the cross-correlation factor of the significant pulse and the original record, the predominant pulse inherent in a record is also shown for better identification and understanding.