Running the Analysis
After introducing the model’s configuration and carrying out the eigenvalue analysis, the user is then ready to run the pushover analysis. This is carried out in the Pushover Analysis or Dynamic Analysis area of SeismoBuild by selecting the Run Analysis button.
Depending on the size of the structure, the selected frame elements type, the applied loads and the processing capacity of the computer being used, the analysis may last from some seconds to several minutes.
As the analysis is running, a progress bar provides the user with a percentage indication of how far has the former advanced to, and a message placed above the progress bar informs about the number of the analysis that is running. Users can in this manner quickly assess the waiting time required for the analysis to be completed, and hence quickly plan their subsequent work schedule. The analysis can also be paused, enabling users to (i) momentarily free computing resources so as to carry out an urgent priority task or (ii) check the results obtained up to that point, which may be useful to decide the worthiness of progressing with the other analyses. If the user presses the Run Analysis button again, the analysis can be continued.
Further, the user has also the option of graphically observing the real-time plotting of a capacity (static pushover) curve of the control node and respective degree-of-freedom or the top displacement vs. time diagram (dynamic analysis). This option, however, might slow down the analysis and increase its running time when used in relatively slow computers, for which reason the user has also the possibility of simply disabling any real-time plotting, choosing to follow only the analysis logs.
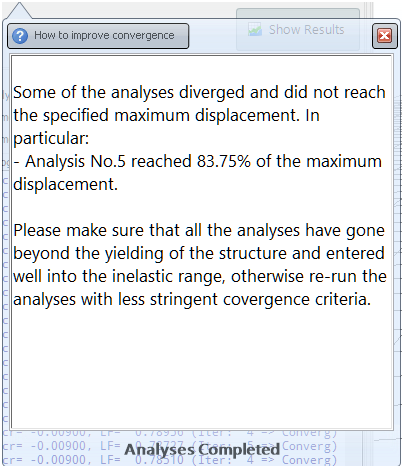
When the analyses are completed, a message appears that provided information about the execution of the analyses. In particular, the message informs if the whole process was successfully completed, (i.e. all the analyses have reached the specified maximum displacement or all the steps of the defined time histories in dynamic analysis have been completed), or whether the SeismoBuild solver could not execute all the analyses until the end, because of convergence difficulties. In the last case the message informs about the percentage of the maximum displacement reached when the analysis terminated.
Notes
- Whenever the real-time deformed shape of the structure is difficult to interpret (because displacements are either too large or too small), users can right-click on the plotting window and adjust its respective Deformed Shape Multipliers. The 3D Plot Options are also available for further fine-tuning. Please refer to the Deformed shape viewer section for further hints and info on real-time visualisation of a model’s deformed shape.
- The current version of SeismoBuild is not capable of taking advantage of multi-processor computing hardware; hence, speed of a single analysis may be increased only by increasing the CPU speed (together with the speeds of the CPU Cache, the Front Side Bus, the RAM modules, the Video RAM, the Hard-Disk (rotation and access)).
- There is a RAM limitation in SeismoBuild (4GB in 64-bit Windows systems and 3GB in 32-bit Windows systems). However, these limits are considerably higher than the RAM required for the assessment of typical building projects.